
Top 5 Trading Patterns for CFDs
Financial derivatives enable traders to hedge against market volatility. This makes derivative instruments incredibly popular. In fact, derivatives trading takes place across 50+ organised exchanges all over the world. One of the most used derivative instruments are CFDs or Contracts for Difference. CFDs provide traders substantial flexibility in rising as well as falling markets. With CFDs, traders can open positions with only a small margin of the total value of the trade. Chart patterns are a great tool for determining CFD trading strategies. Here’s a look at 5 of the most popular trading patterns for trading CFDs.
CFDs come with their share of risk as well, especially when markets are highly volatile. During these periods, losses can be magnified, due to high leverage, should the market change direction unfavourably. One of the ways to improve trading decisions and mitigate risk when trading CFDs is by using trading patterns. So, here are the top 5 trading patterns for CFDs.
1. Head and Shoulders Pattern
The head and shoulders pattern gets its name from its unique appearance. This pattern has a baseline with 3 peaks. The middle peak is the highest, with the 2 outside peaks being of similar height and lower than the middle peak. The neckline is created by joining the first and third troughs. These are the support and resistance levels, used for deciding strategic areas, where orders would be placed.
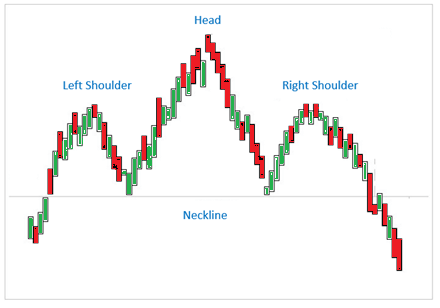
The pattern is particularly helpful for determining reversals in the market. Generally, a reversal from bullish to bearish trend is represented in these patterns. This signals an upward trend ending. The first peak and decline of the pattern represents the reducing momentum before the bullish trend. In wanting to sustain the rising movement, the bulls rally to push the price above the previous peak.
After this, the bears start to gain ground. The price rises a third time but is unable to reach the previous high. This failure to go higher than the previous high signals the defeat of the bulls.
2. Triangle Patterns
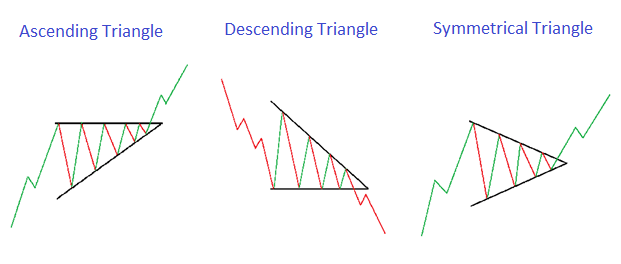
Triangle patterns are great for signaling bullish as well as bearish trends. These patterns are created when there is a sideways trading pattern in the market. This results in the highs becoming lower and the lows becoming higher. Thus, a triangle shape is formed with the resistance and support lines converging at a point. There are 3 types of triangle patterns.
Ascending Triangle Pattern
The ascending triangle is generally a bullish pattern. Here, the top trendline acts as a resistance level and remains flat. The resistance level is drawn along the swing highs. There should be at least 2 swing highs and 2 swing lows for the creation of this pattern. The bottom line, which is a support line, is continually rising.
Descending Triangle Pattern
As the name suggests, this is almost the opposite of the ascending triangle pattern. In descending patterns, the support line is horizontal. While the resistance line is downward sloping, formed by a series of continuously declining highs.
Symmetrical Triangle Pattern
In this pattern, the support line is gradually rising, while the resistance line is slowly declining. This creates a triangle with no horizontal line.
3. Wedge Patterns
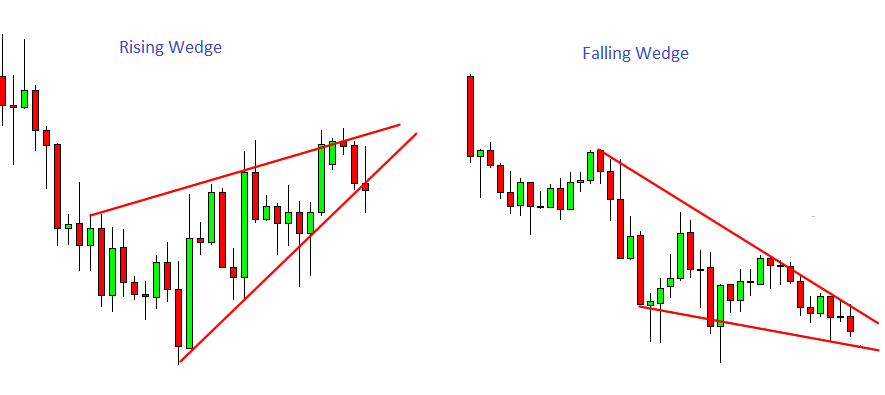
A wedge pattern is generally a good indicator of either a bearish or a bullish price reversal. In both cases, the pattern has 3 characteristics. First, trend lines that are converging towards each other. Second, as the pattern progresses, there is a decline in trade volume. Third, from one of the trend lines, there is a breakout.
There are 2 types of wedge patterns: falling wedge and rising wedge patterns. Rising wedge patterns are generally formed when the price has been rising over time. The trend lines form an upward wedge in this scenario. These patterns signal a bearish reversal. Falling wedge patterns are formed when the trendline is on a downward move. This signals a bearish reversal.
4. Flag Pattern
These patterns resemble a flag on a flagpole, hence the name. These patterns are created when the price of an asset rises, followed by consolidation. Usually, in the beginning stages of the trend, there are significant increases. In the later stages, the trend experiences smaller upward and downward movements. These patterns can be bullish as well as bearish. Plus, they can represent a reversal or continuation of a trend.
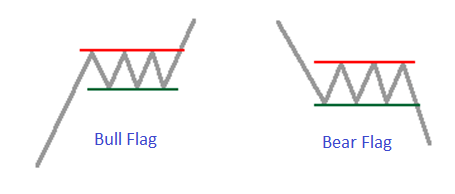
Flag patterns can look like a triangle or wedge pattern too. But unlike the other 2, flag patterns are always horizontal. Additionally, they are narrower than the triangle and wedge patterns.
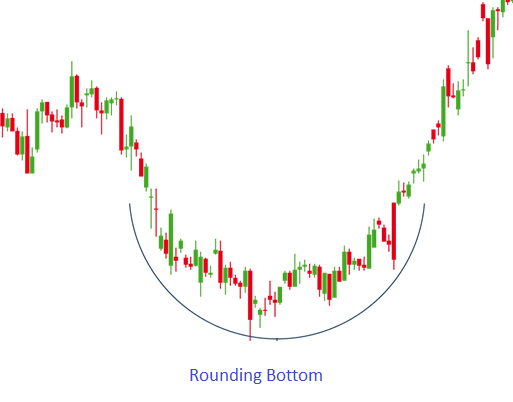
5. Rounding Bottom Pattern
Rounding bottom patterns are identifiable by their “U” shape. These patterns are usually found at the end of long downward trends, signifying a reversal of the price movement. The timeframe of this pattern can vary from just a few weeks to several months. Initially, the declining slope in this pattern signifies excess supply. This causes the price to decline. Once the buyers enter the market at a low price, the demand increases as well as the price. This pattern is an indicator of a reversal in the market from bearish to bullish tendencies.
Trading patterns are a great tool for planning stop loss strategies and identifying entry and exit levels. But when using trading patterns, it is also a good idea to watch them over long periods. This improves their reliability. In shorter timeframes, these patterns could produce false signals.
Reference Links
Investopedia, Dailypriceaction.


