
Using Technical Analysis for Breakout Trading
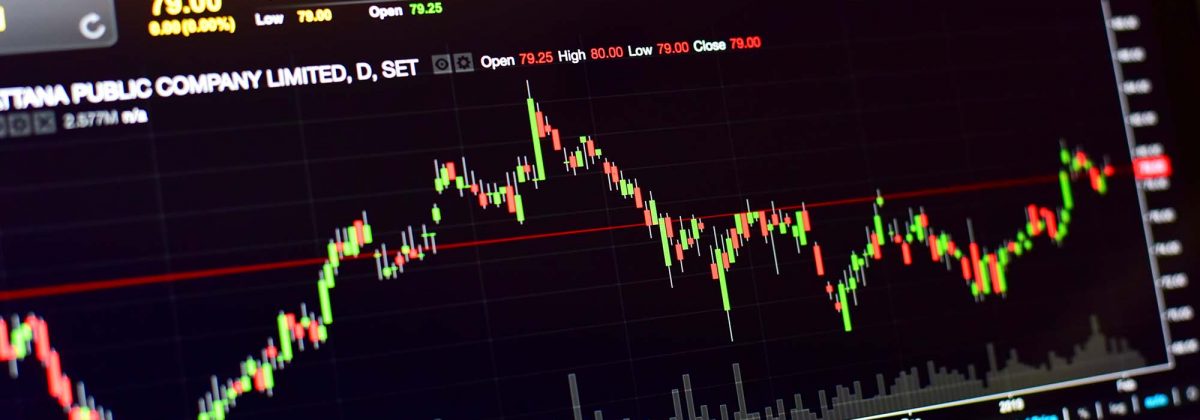
Breakouts refer to asset prices moving beyond the defined support and resistance levels. Since all traders do not go by the same support and resistance levels, breakouts will also differ from trader to trader. But once identified, it indicates the potential for prices to trend in a new direction. Volume is considered a key indicator in confirming the start of a new trend. Breakouts occurring on higher than usual volumes are more reliable. In forex trading, breakouts can be important indicators of changing supply and demand levels of a currency pair.
Why Trade Breakouts?
Breakouts can offer trading opportunities. This is because price breakouts often lead to new trends and it is during this period that traders usually like to enter the market to leverage the emerging trend. For instance, a breakout towards the upside could be a signal to enter a long position, and vice versa. Also, confirmed breakouts tend to take place at high momentum. The rapid price moves could provide trading opportunities. However, this high volatility could be extremely risky as well, which is why proper stop-loss strategies are essential.
It is important to understand that such breakouts can take place on all psychological price levels, apart from support and resistance. This can include pivot points, Fibonacci levels, moving averages, trend lines and so on. There are many indicators that can be used to identify and trade a potential breakout pattern.
Identifying and Trading Breakouts Using Support and Resistance Levels
Support and resistance lines, drawn at probable breakout points, should not be considered as fixed but rather as price zones. When price conforms to the same levels again and again, it can be assumed as a probable psychological area. The distance between the lowest and highest level of the price in this area can be said to be the support and resistance area. The more times the asset price touches these levels, the more their importance, and the longer the levels continue, the better the outcome when the breakout actually occurs.
As the prices consolidate, various price patterns like channels, flags and triangles might be observed on the charts. These can be considered as positive signals that a trader has chosen the right asset to trade in the current market environment. In fact, seasoned traders often rely on chart patterns to spot breakouts, as ranges can be identified by all traders, leading to market saturation. Triangles and flags could provide cleaner breakout signals and better risk-reward ratios.
Once the asset price makes a break above the resistance level, a trader might take up a bullish position. Similarly, when the price falls below the support level, a bearish position might be assumed. It is important here for traders to filter out false breakout signals. There is no guarantee that the price will continue in the same trajectory, so presence of just a candlewick outside a psychological area cannot be considered reliable. A more reliable signal would be if the price of the candle closes beyond the resistance or support level. Many traders wait for above average volume to confirm a breakout.
Setting a reasonable trade objective is the next course of action, without which it would be difficult to plan an exit. This could be done by calculating the average distance between the support and resistance levels, or by looking back at the recent price action. Calculating the recent price swings and getting their average can also help to set a reasonable price target.
After a breakout takes place, old resistance levels typically become new support levels, and old support levels become the new resistance levels. If this doesn’t happen, there are chances that the trade has failed, in which case the best idea is to exit the trade quickly, using the old support and resistance levels. In most trades, after a breakout, the asset price re-tests the old support and resistance levels after a couple of days.
If a trader is not exiting a trade with a loss at this juncture, then the trade can continue until the price reaches the target level.
The Second Chance Breakout Strategy
In the prior strategy, it was seen that quite often, but not always, prices do not move in a clear direction, but rather re-test the old breakout point, after a couple of days. It doesn’t have to touch the old breakout point, but if it comes fairly close, it can provide traders a second chance to enter a position.
This is called a second chance entry. In case the price breaks out above a chart pattern or a defined support-resistance area, the second chance entry will provide an opportunity to go long. If price breaks below the chart pattern, it could be a signal to go short.
In case the original breakout was in the downward direction, traders could wait for the price to move higher and drop again, in order to confirm the move. This helps manage risks. Stop-loss can be placed a few pips above the pullback high.
Similarly, if the original breakout was in an upward direction, traders could wait for the price to pullback lower, before rallying again. This could be a signal to go long. Here, the stop-loss can be placed a couple of pips away from the pullback low.
The second chance strategy is a good way to steer clear of false breakouts. However, such chances are low, since after a strong breakout, viable pullbacks might not occur.
Risks of Breakout Strategies
The first risk is the chance that a trader is lured by false breakouts. Sudden price reversals after a breakout are common and could occur multiple times before a viable breakout actually takes place. At other times, the signals could be solid, but due to a low level of market participation, the trades might not be successful.
When the breakout setup creates increased market participation, optimal entry prices may get saturated with pending market orders. It becomes difficult to enter the market efficiently, giving rise to slippage. This could make it challenging to maintain a consistent profit level. But through proper methodology and sound risk management techniques, trading breakouts could become worthwhile.
Reference Links
- https://www.thebalance.com/the-second-chance-breakout-day-trading-strategy-1031465
- https://www.investopedia.com/terms/b/breakout.asp
- https://forextraininggroup.com/a-step-by-step-guide-to-trading-breakouts-in-forex/
- https://www.thebalance.com/three-better-ways-to-day-trade-breakouts-1030880
- https://www.investopedia.com/articles/trading/08/trading-breakouts.asp


