
Everything You Need to Know About Bullish and Bearish Flag Patterns

Based on potential price moves, chart patterns can be divided into continuation and reversal categories. Flag patterns are high probability continuation patterns, indicating short term price consolidation (a counter trend move), after an aggressive move, higher or lower. Following this consolidation, the price tends to breakout in the direction of the prevailing trend.
Flags can form over any timeframe. Typically, the formation is completed in 5 to 15 candlestick bars. They help traders identify the current stage of the prevailing trend, and whether the consolidation phase is over. With the breakout, traders can calculate precise price targets for their positions.
Flag patterns are considered useful for short-term targets. Long-term traders can look into other patterns, like the inverted head and shoulders.
Before we move on to how flags can be used to plan trades, let’s understand their structure and types.
The Structure of Flag Patterns
The first part of the pattern is the flag pole, which represents a strong price movement (upwards or downwards). Following this short-lived trend impulse, the price goes into a consolidation phase, which forms the body of the flag. This is a slow counter trend move, similar to a parallelogram. The price tops and bottoms are evenly distributed. The body of the flag is at an angle, contrary to the trend impulse of the pole.
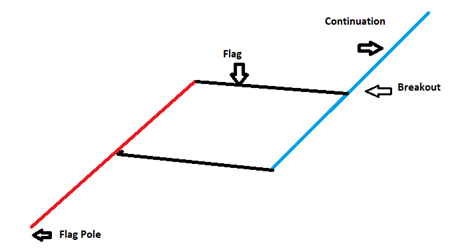
After the price consolidation, the price breaks out in the direction of the preceding trend. This can be upwards or downwards. This is what differentiates bullish and bearish flag patterns.
Types of Flag Patterns: Bullish and Bearish
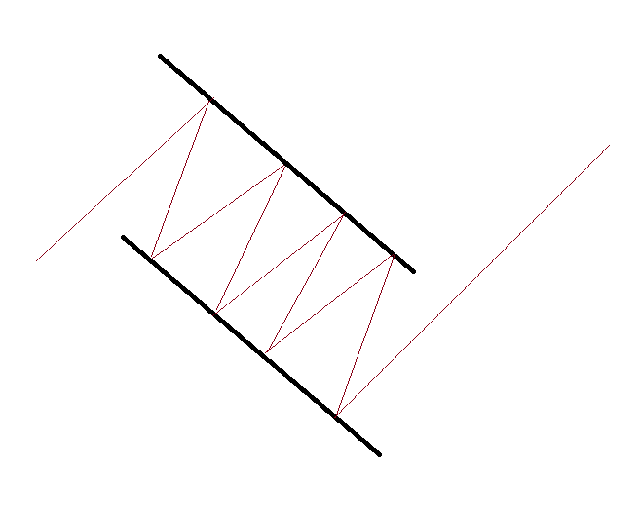
In a bullish flag, the consolidation is a little lower, after an aggressive price move upwards. After the temporary consolidation, the price continues along the uptrend. Here, the slope of the price channel is tilted downwards during the consolidation phase, in a counter trend move. Bullish flags indicate stronger buying pressure in the market, which is why overall price momentum is upwards.
Bullish Flag
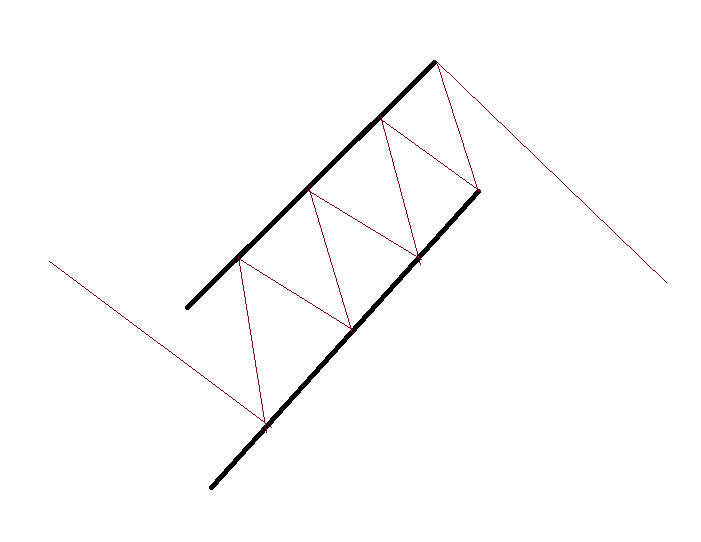
Similarly, in a bearish flag pattern, the extension of the downtrend continues after the temporary consolidation. The slope of the consolidation channel is angled upwards. The selling pressure is higher, taking the overall price momentum downwards.
Bearish Flag
In the consolidation phase, buyers might try to weaken the momentum of the sellers. Bears, on the other hand, consolidate recent gains to push the price further down. This is why in both bullish and bearish formations the pattern isn’t considered to be confirmed till the breakout actually happens.
How to Trade Flag Patterns
Entry Signal
In the bullish flag, when the price moves higher and consolidates to create a support and resistance level, a buy signal is considered when the price action closes a candle above the upper resistance line.
Similarly, in the bearish flag, a short position can be taken at a point where the price action closes a candle below the lower support line.
Stop Loss
When deciding on a stop-loss strategy for flag patterns, one basic rule is to always exit the trade when the price breaches in the opposite direction of the breakout. This indicates a false pattern.
In case of a bullish flag, the stop-loss can be placed below the lowest bottom of the flag. For a bearish flag, the highest top in the flag could be ideal for the stop-loss position.
Profit Target
In trading flags, there are two ways to calculate the target distance:
1. Size of the flag
The vertical distance between the upper and lower channel within the flag is the size of the flag. This is also known as the measured move target. This distance has to be applied, starting from the point of breakout. At the end of this distance is the profit target.
2. Size of the Pole
The vertical distance between the high and low of the pole is measured. This distance is applied from the breakout point, just like the above target. The measured distance is the profit target.
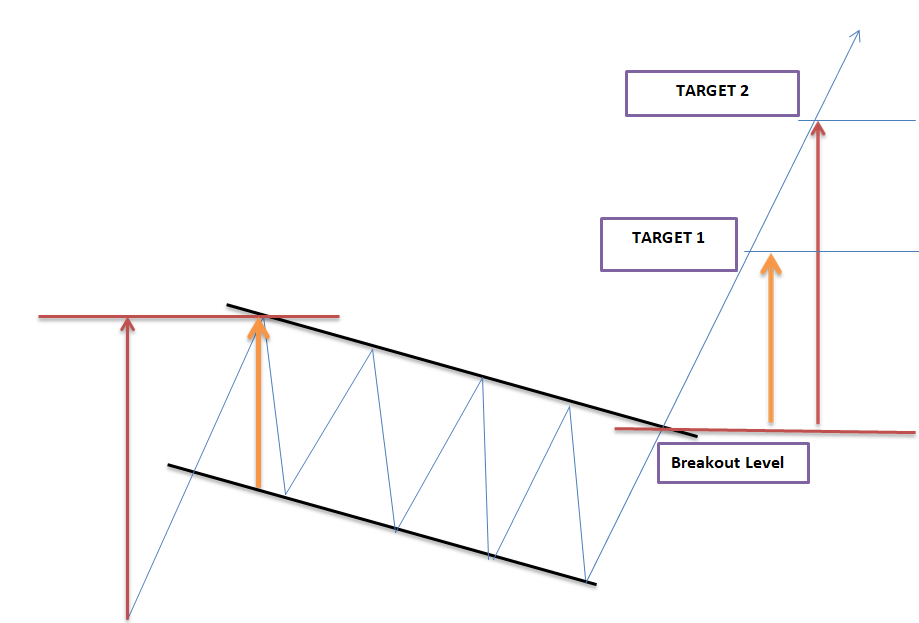
The decision to take profit at target 1 or target 2 depends on the traders’ risk appetite. Some traders take profit at both the levels, to minimize risk.
The Importance of Volume in Flag Patterns
A trade signal resulting from a flag pattern is considered reliable, if volume is present alongside breakouts. Traders use volume indicators, along with flag patterns, to validate the formations.
There needs to be high trade volume during the pole formation, lower volume in the consolidation phase, and again a high volume when the price breaks out.
For instance, in a bullish flag pattern, traders look for increasing volume in the uptrend or the flag pole. This indicates increasing buying pressure. The consolidation phase should have low or declining volume, indicating lower buying enthusiasm in the ranging market.
This high volume is a move upwards, while low volume in the counter trend shows that the overall momentum of the market is towards the upside.
Volume is also important to avoid false breakouts. Real breakouts usually happen with high volume, in the direction of the breakout. If this is absent, then the breakout might not materialise. So, high volume in the breakout phase indicates a proper and tradable flag pattern.
Flags are Different from Pennants
Pennant is another continuation pattern and closely resembles the flag pattern. However, the correction channel in the flag pattern is a parallelogram, while in a pennant, this correction is triangular shaped. This correction is angled against the trend.
On the other hand, in both cases, the potential of the patterns is the same and they can be traded in a similar manner.
Chart patterns are a staple part of technical analysis. These are often found when the price movement takes a break to form a consolidation channel. These channels can result in reversal or continuation of the prevailing trend. Trendlines are important to identify these patterns, as well as the associated volumes. Use a demo account to gain familiarity with different chart patterns to gain confidence in using them on the live markets.
Reference Links
Moneycontrol, TheBalance, Forextraininggroup, Investopedia.


